Ramanujan Filter Banks
Period estimation using RFB - (spkit version 0.0.9.4)
Finding the hidden patterns that repeats
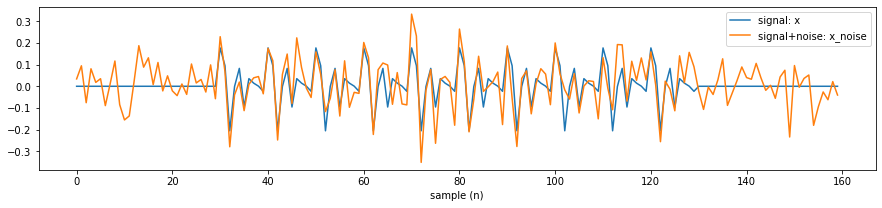
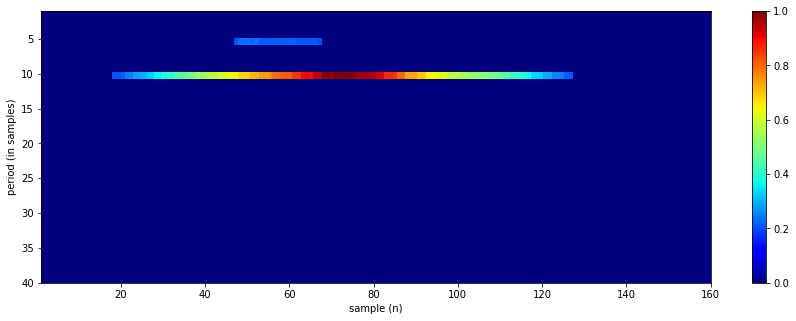
Single pattern with period of 10
Same example as author has shown
import numpy as np
import matplotlib.pyplot as plt
import scipy.linalg as LA
import spkit as sp


seed = 10
np.random.seed(seed)
period = 10
SNR = 0

x1 = np.zeros(30)
x2 = np.random.randn(period)
x2 = np.tile(x2,10)
x3 = np.zeros(30)
x  = np.r_[x1,x2,x3]
x /= LA.norm(x,2)

noise  = np.random.randn(len(x))
noise /= LA.norm(noise,2)

noise_power = 10**(-1*SNR/20)

noise *= noise_power
x_noise = x + noise

plt.figure(figsize=(15,3))
plt.plot(x,label='signal: x')
plt.plot(x_noise, label='signal+noise: x_noise')
plt.xlabel('sample (n)')
plt.legend()
plt.show()


Pmax = 40   #Largest period expected in signal
Rcq  = 10   #Number of repeats in each Ramanujan filter
Rav  = 2    #length of averaging filter
thr  = 0.2  #to filter out any value below Thr

y = sp.RFB(x_noise,Pmax, Rcq, Rav, thr)

plt.figure(figsize=(15,5))
im = plt.imshow(y.T,aspect='auto',cmap='jet',extent=[1,len(x_noise),Pmax,1])
plt.colorbar(im)
plt.xlabel('sample (n)')
plt.ylabel('period (in samples)')
plt.show()

plt.stem(np.arange(1,y.shape[1]+1),np.sum(y,0))
plt.xlabel('period (in samples)')
plt.ylabel('strength')
plt.show()

print('top 10 periods: ',np.argsort(np.sum(y,0))[::-1][:10]+1)
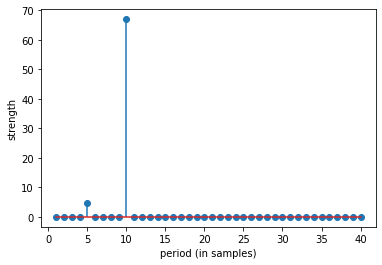
top 10 periods: [10 5 11 18 17 16 15 14 13 12]
Multiple pattern with periods of 3,7 and 10
Same example as author has shown
import numpy as np
import matplotlib.pyplot as plt
import scipy.linalg as LA
import spkit as sp


np.random.seed(15)
#periods    = [3,7,11]
#signal_length = 100
#SNR = 10
x = np.zeros(signal_length)
for period in periods:
    x_temp  = np.random.randn(period)
    x_temp  = np.tile(x_temp,int(np.ceil(signal_length/period)))
    x_temp  = x_temp[:signal_length]
    x_temp /= LA.norm(x_temp,2)
    x += x_temp

x /= LA.norm(x,2)

noise  = np.random.randn(len(x))
noise /= LA.norm(noise,2)
noise_power = 10**(-1*SNR/20)
noise *= noise_power
x_noise = x + noise

plt.figure(figsize=(15,3))
plt.plot(x,label='signal: x')
plt.plot(x_noise, label='signal+noise: x_noise')
plt.xlabel('sample (n)')
plt.legend()
plt.show()


Pmax = 90

periodE = sp.PeriodStrength(x_noise,Pmax=Pmax,method='Ramanujan',lambd=1, L=1, cvxsol=True)

plt.stem(np.arange(len(periodE))+1,periodE)
plt.xlabel('period (in samples)')
plt.ylabel('strength')
plt.title('L1 + penality')
plt.show()

print('top 10 periods: ',np.argsort(periodE)[::-1][:10]+1)


periodE = sp.PeriodStrength(x_noise,Pmax=Pmax,method='Ramanujan',lambd=0, L=1, cvxsol=True)

plt.stem(np.arange(len(periodE))+1,periodE)
plt.xlabel('period (in samples)')
plt.ylabel('strength')
plt.title('L1 without penality')
plt.show()


print('top 10 periods: ',np.argsort(periodE)[::-1][:10]+1)


periodE = sp.PeriodStrength(x_noise,Pmax=Pmax,method='Ramanujan',lambd=1, L=2, cvxsol=False)

plt.stem(np.arange(len(periodE))+1,periodE)
plt.xlabel('period (in samples)')
plt.ylabel('strength')
plt.title('L2 +  penalty')
plt.show()

print('top 10 periods: ',np.argsort(periodE)[::-1][:10]+1)


y = sp.RFB(x_noise,Pmax = Pmax, Rcq=10, Rav=2, Th=0.2)

plt.figure(figsize=(15,5))
im = plt.imshow(y.T,aspect='auto',cmap='jet',extent=[1,len(x_noise),Pmax,1])
plt.colorbar(im)
plt.xlabel('sample (n)')
plt.ylabel('period (in samples)')
plt.show()

plt.stem(np.arange(1,y.shape[1]+1),np.sum(y,0))
plt.xlabel('period (in samples)')
plt.ylabel('strength')
plt.show()

print('top 10 periods: ',np.argsort(np.sum(y,0))[::-1][:10]+1)


XF = np.abs(np.fft.fft(x_noise))[:1+len(x_noise)//2]
fq = np.arange(len(XF))/(len(XF)-1)

plt.stem(fq,XF)
plt.title('DFT')
plt.ylabel('| X |')
plt.xlabel(r'frequency $\times$ ($\omega$/2)   ~   1/period ')
plt.show()